







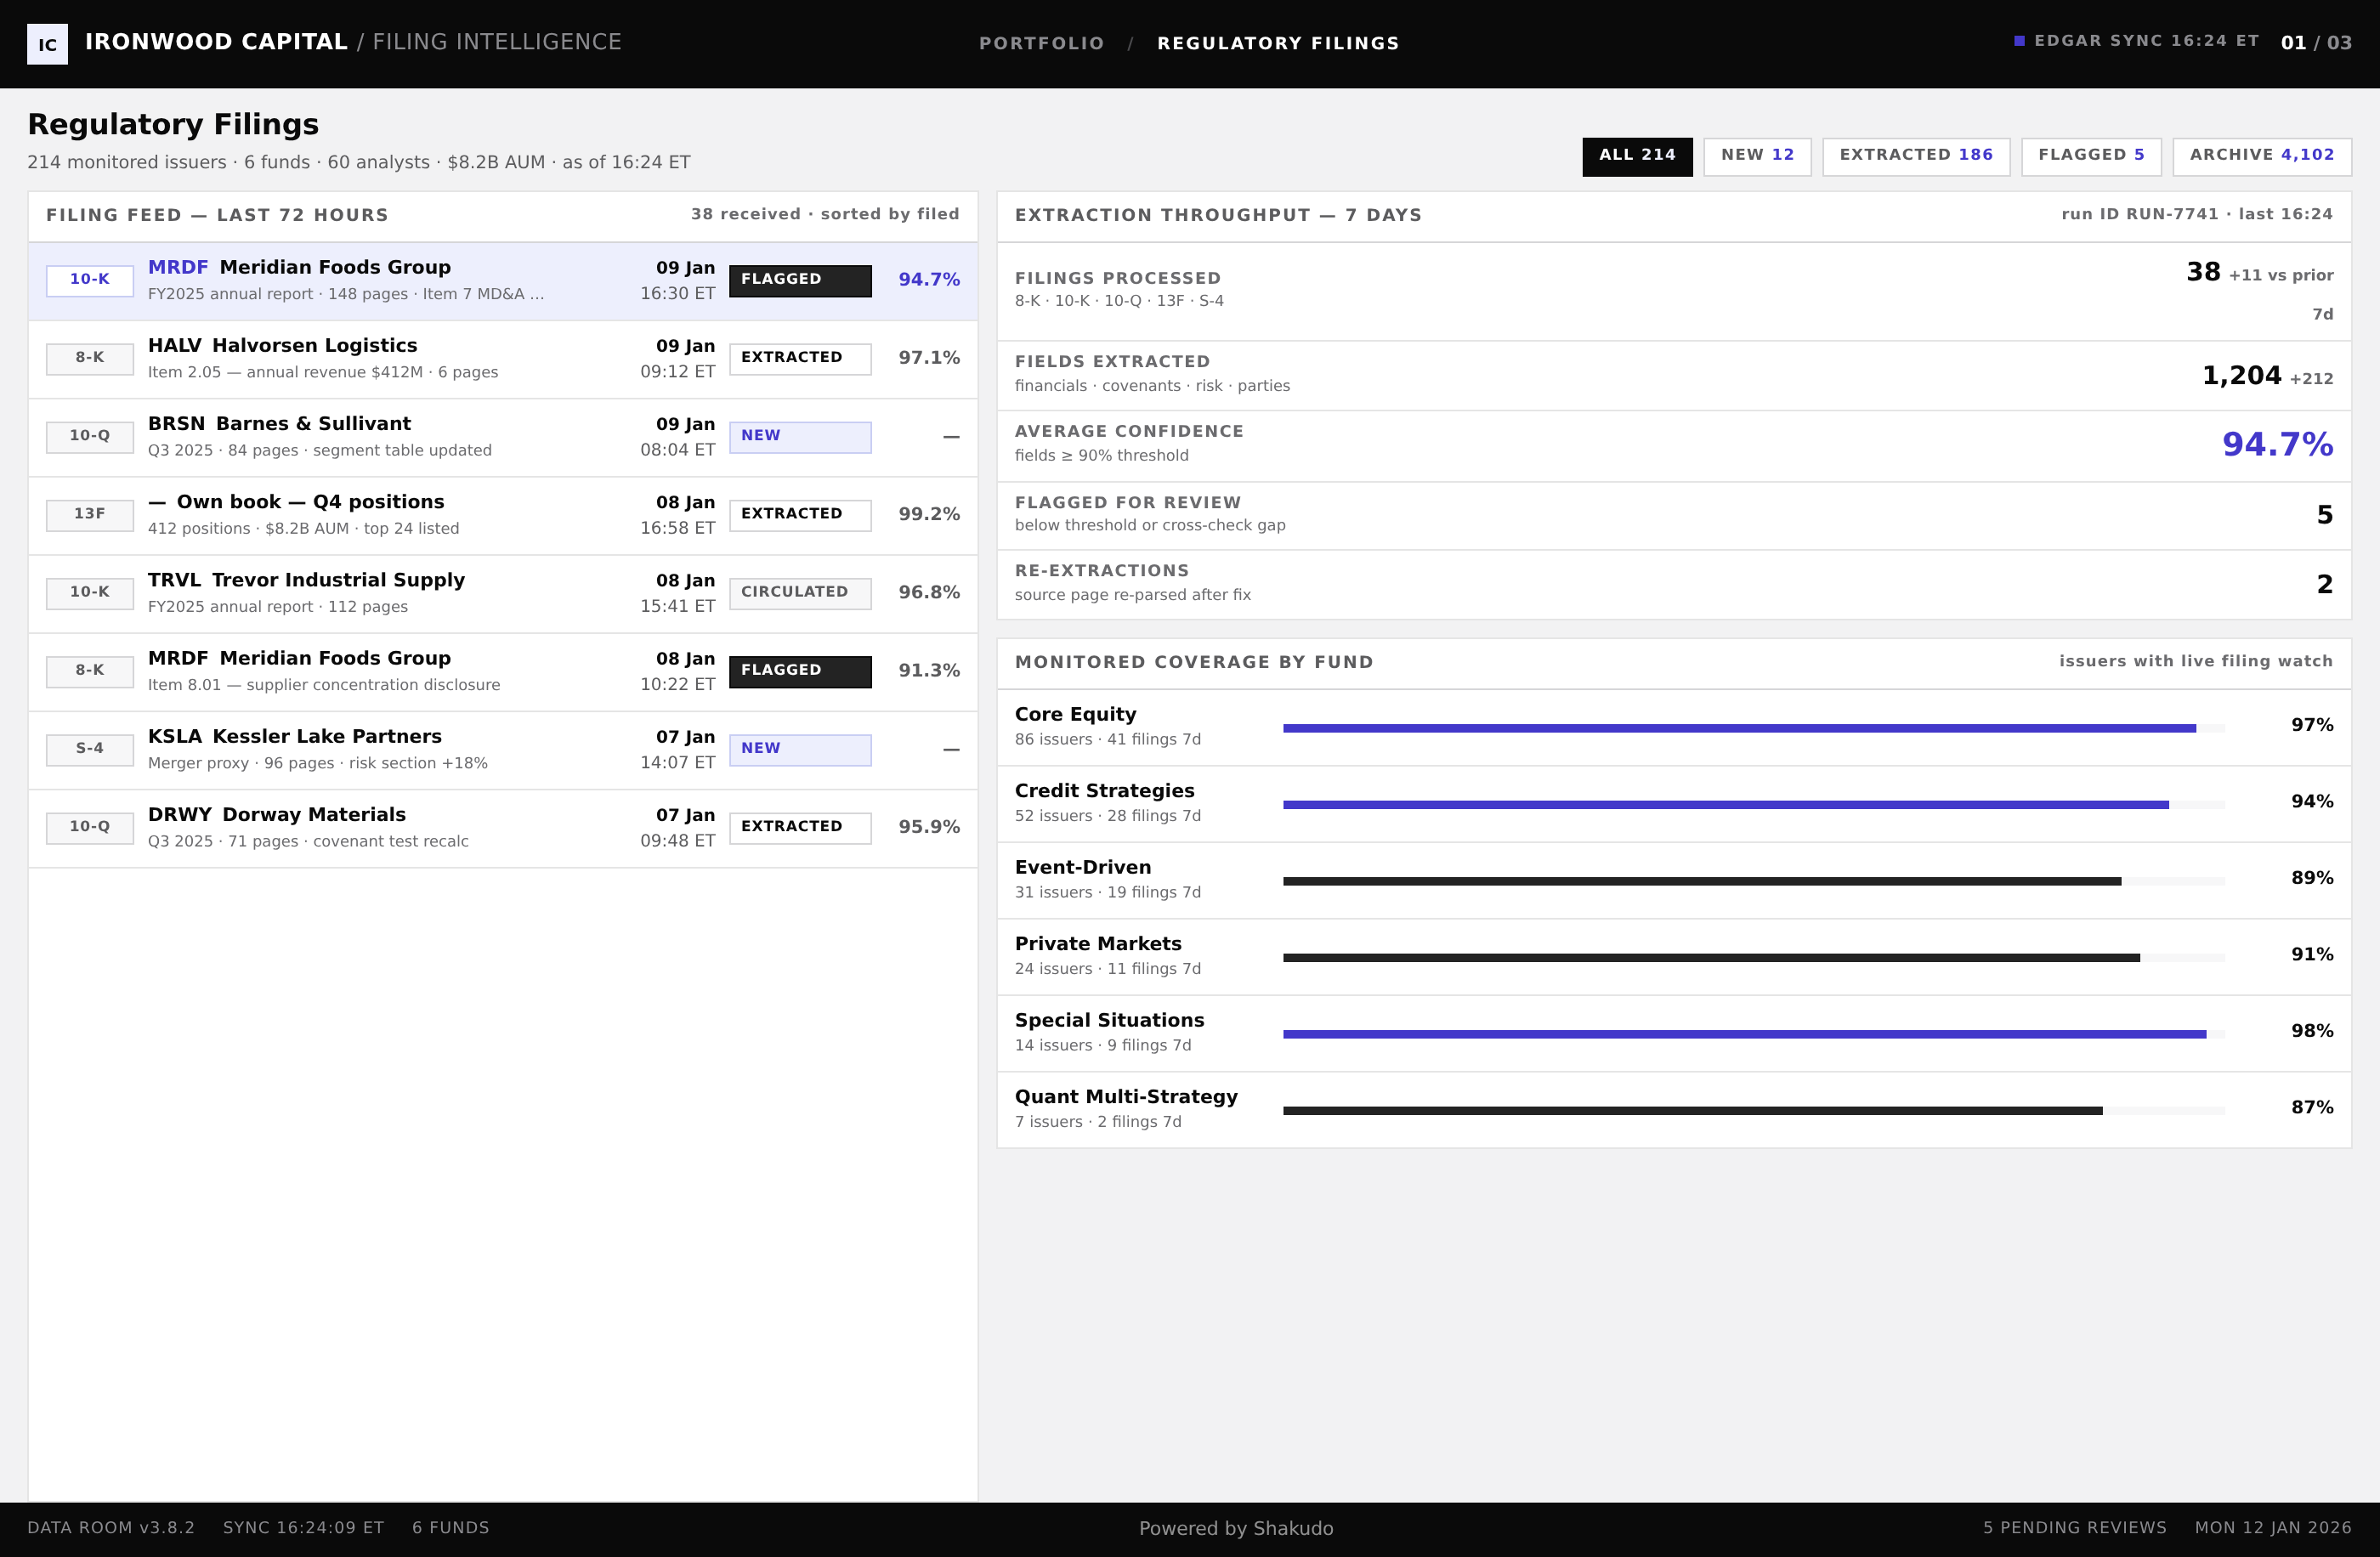
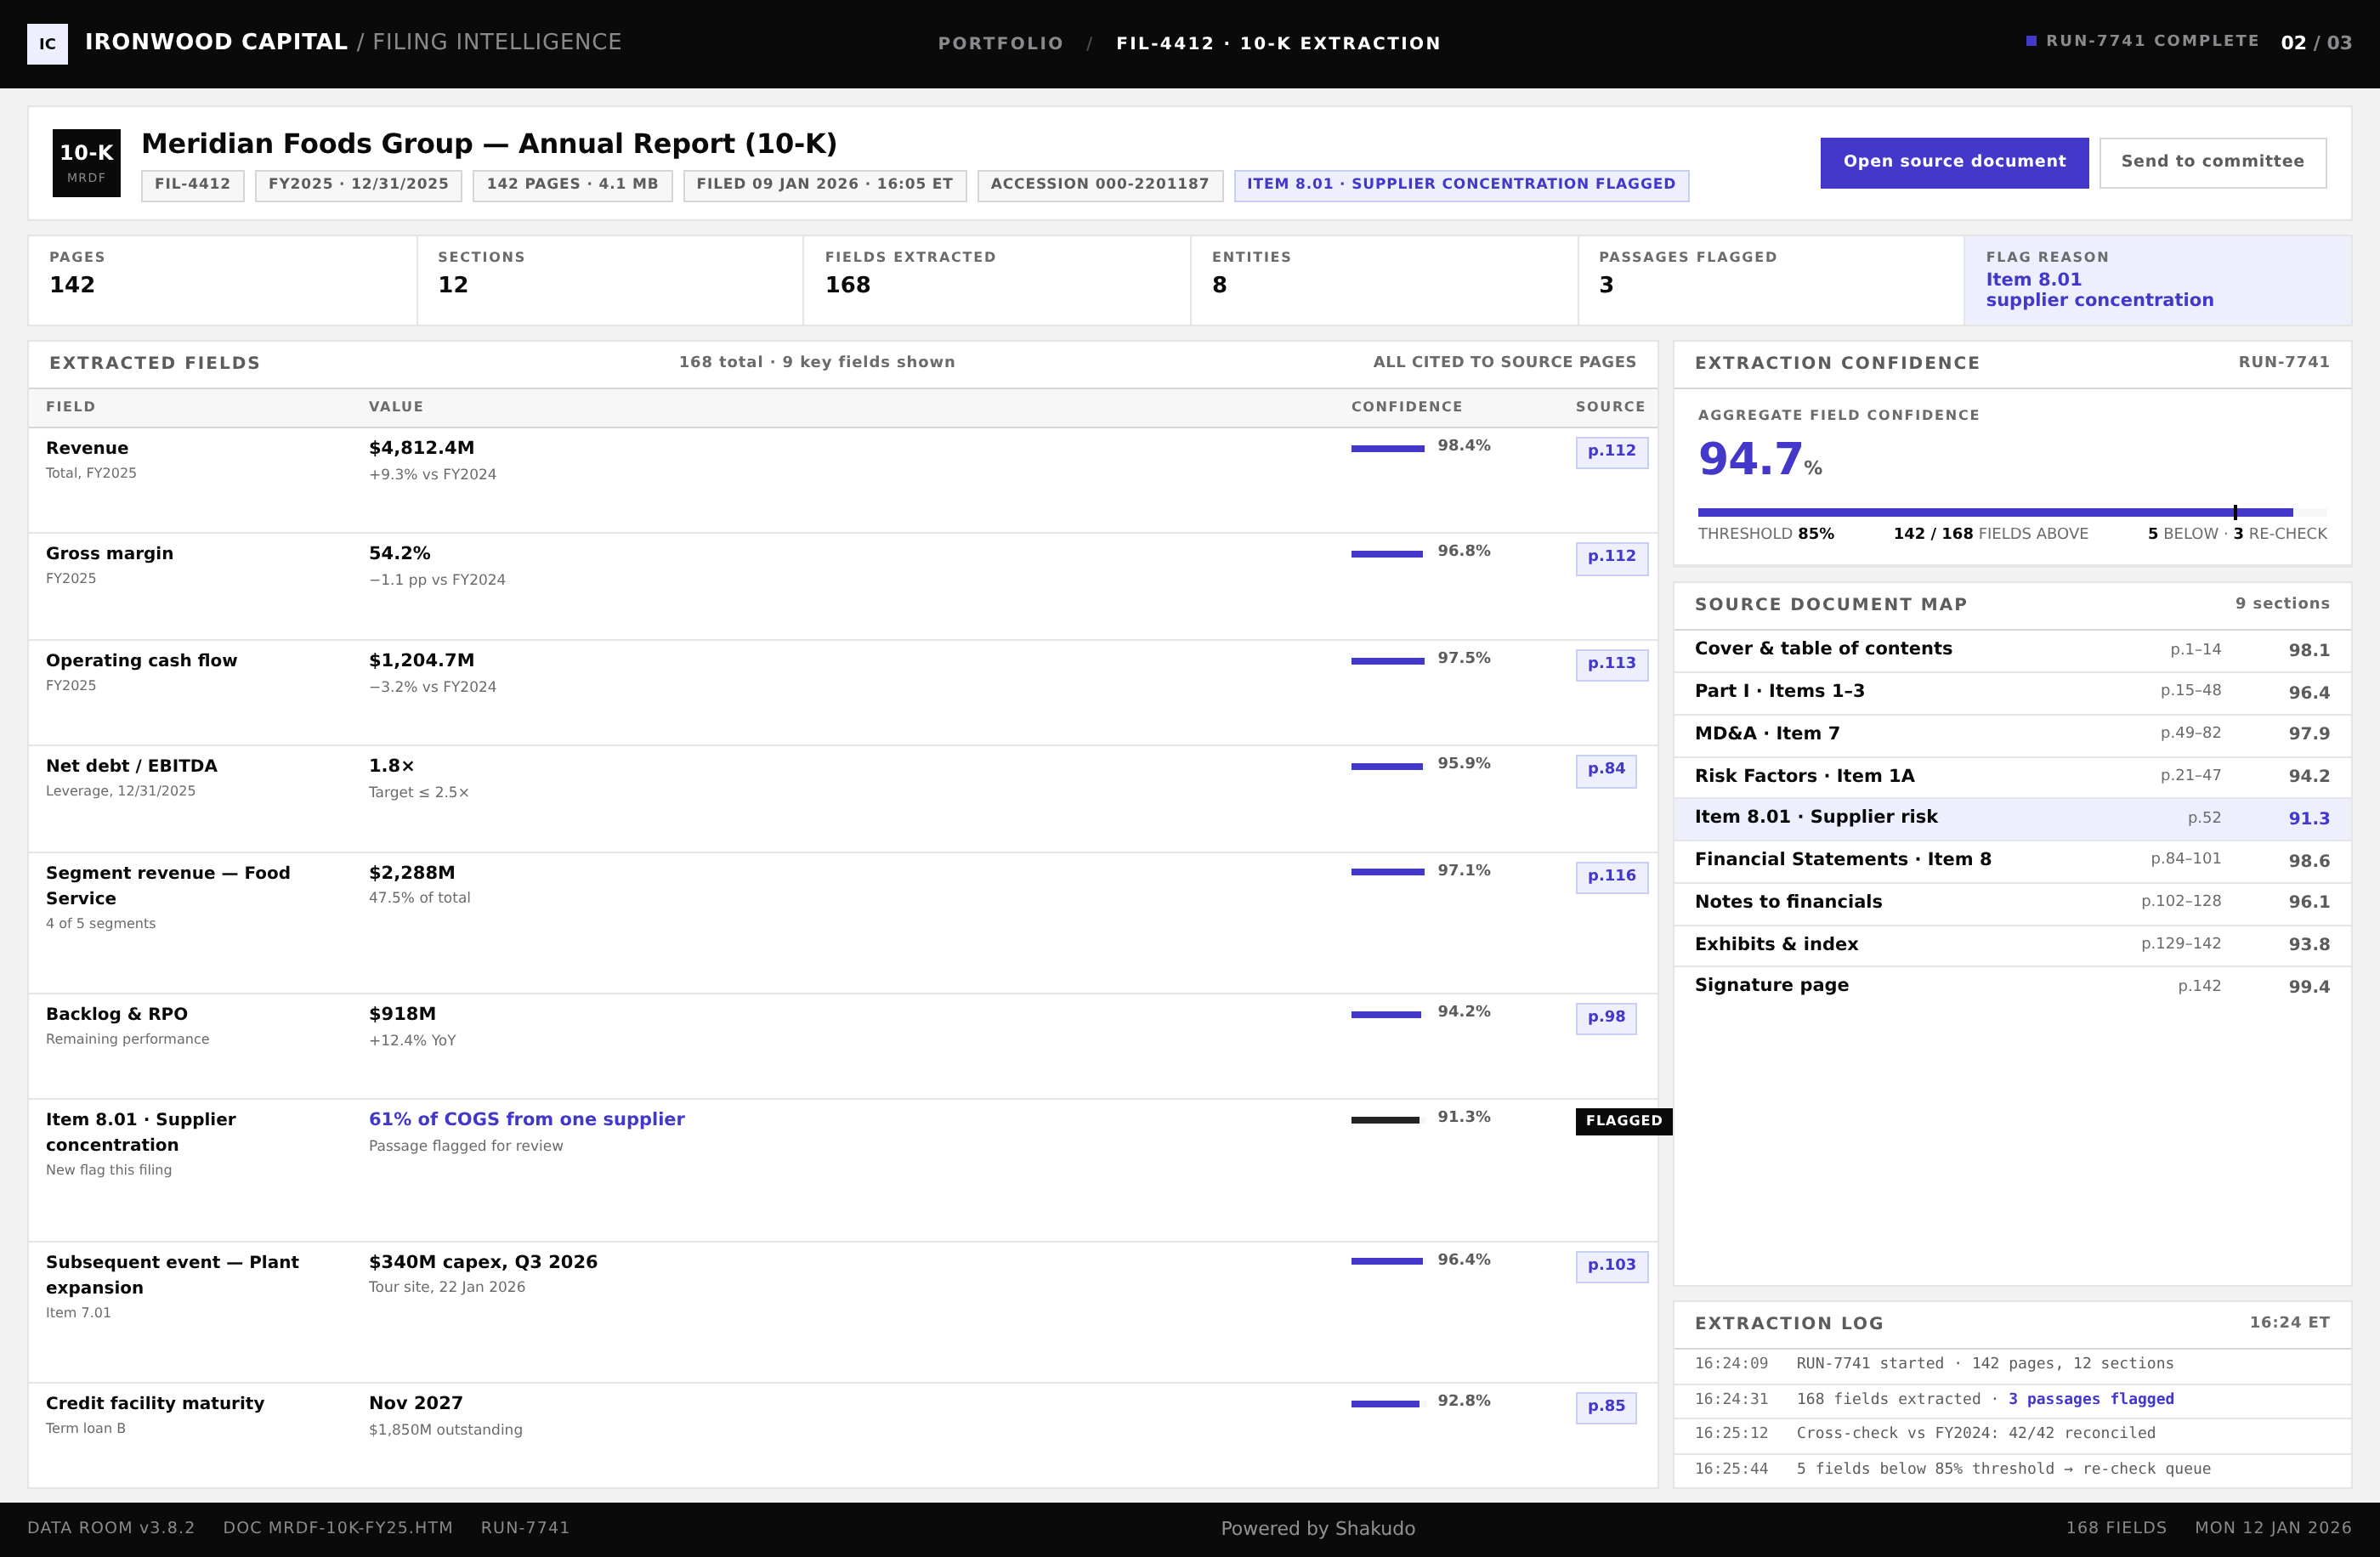
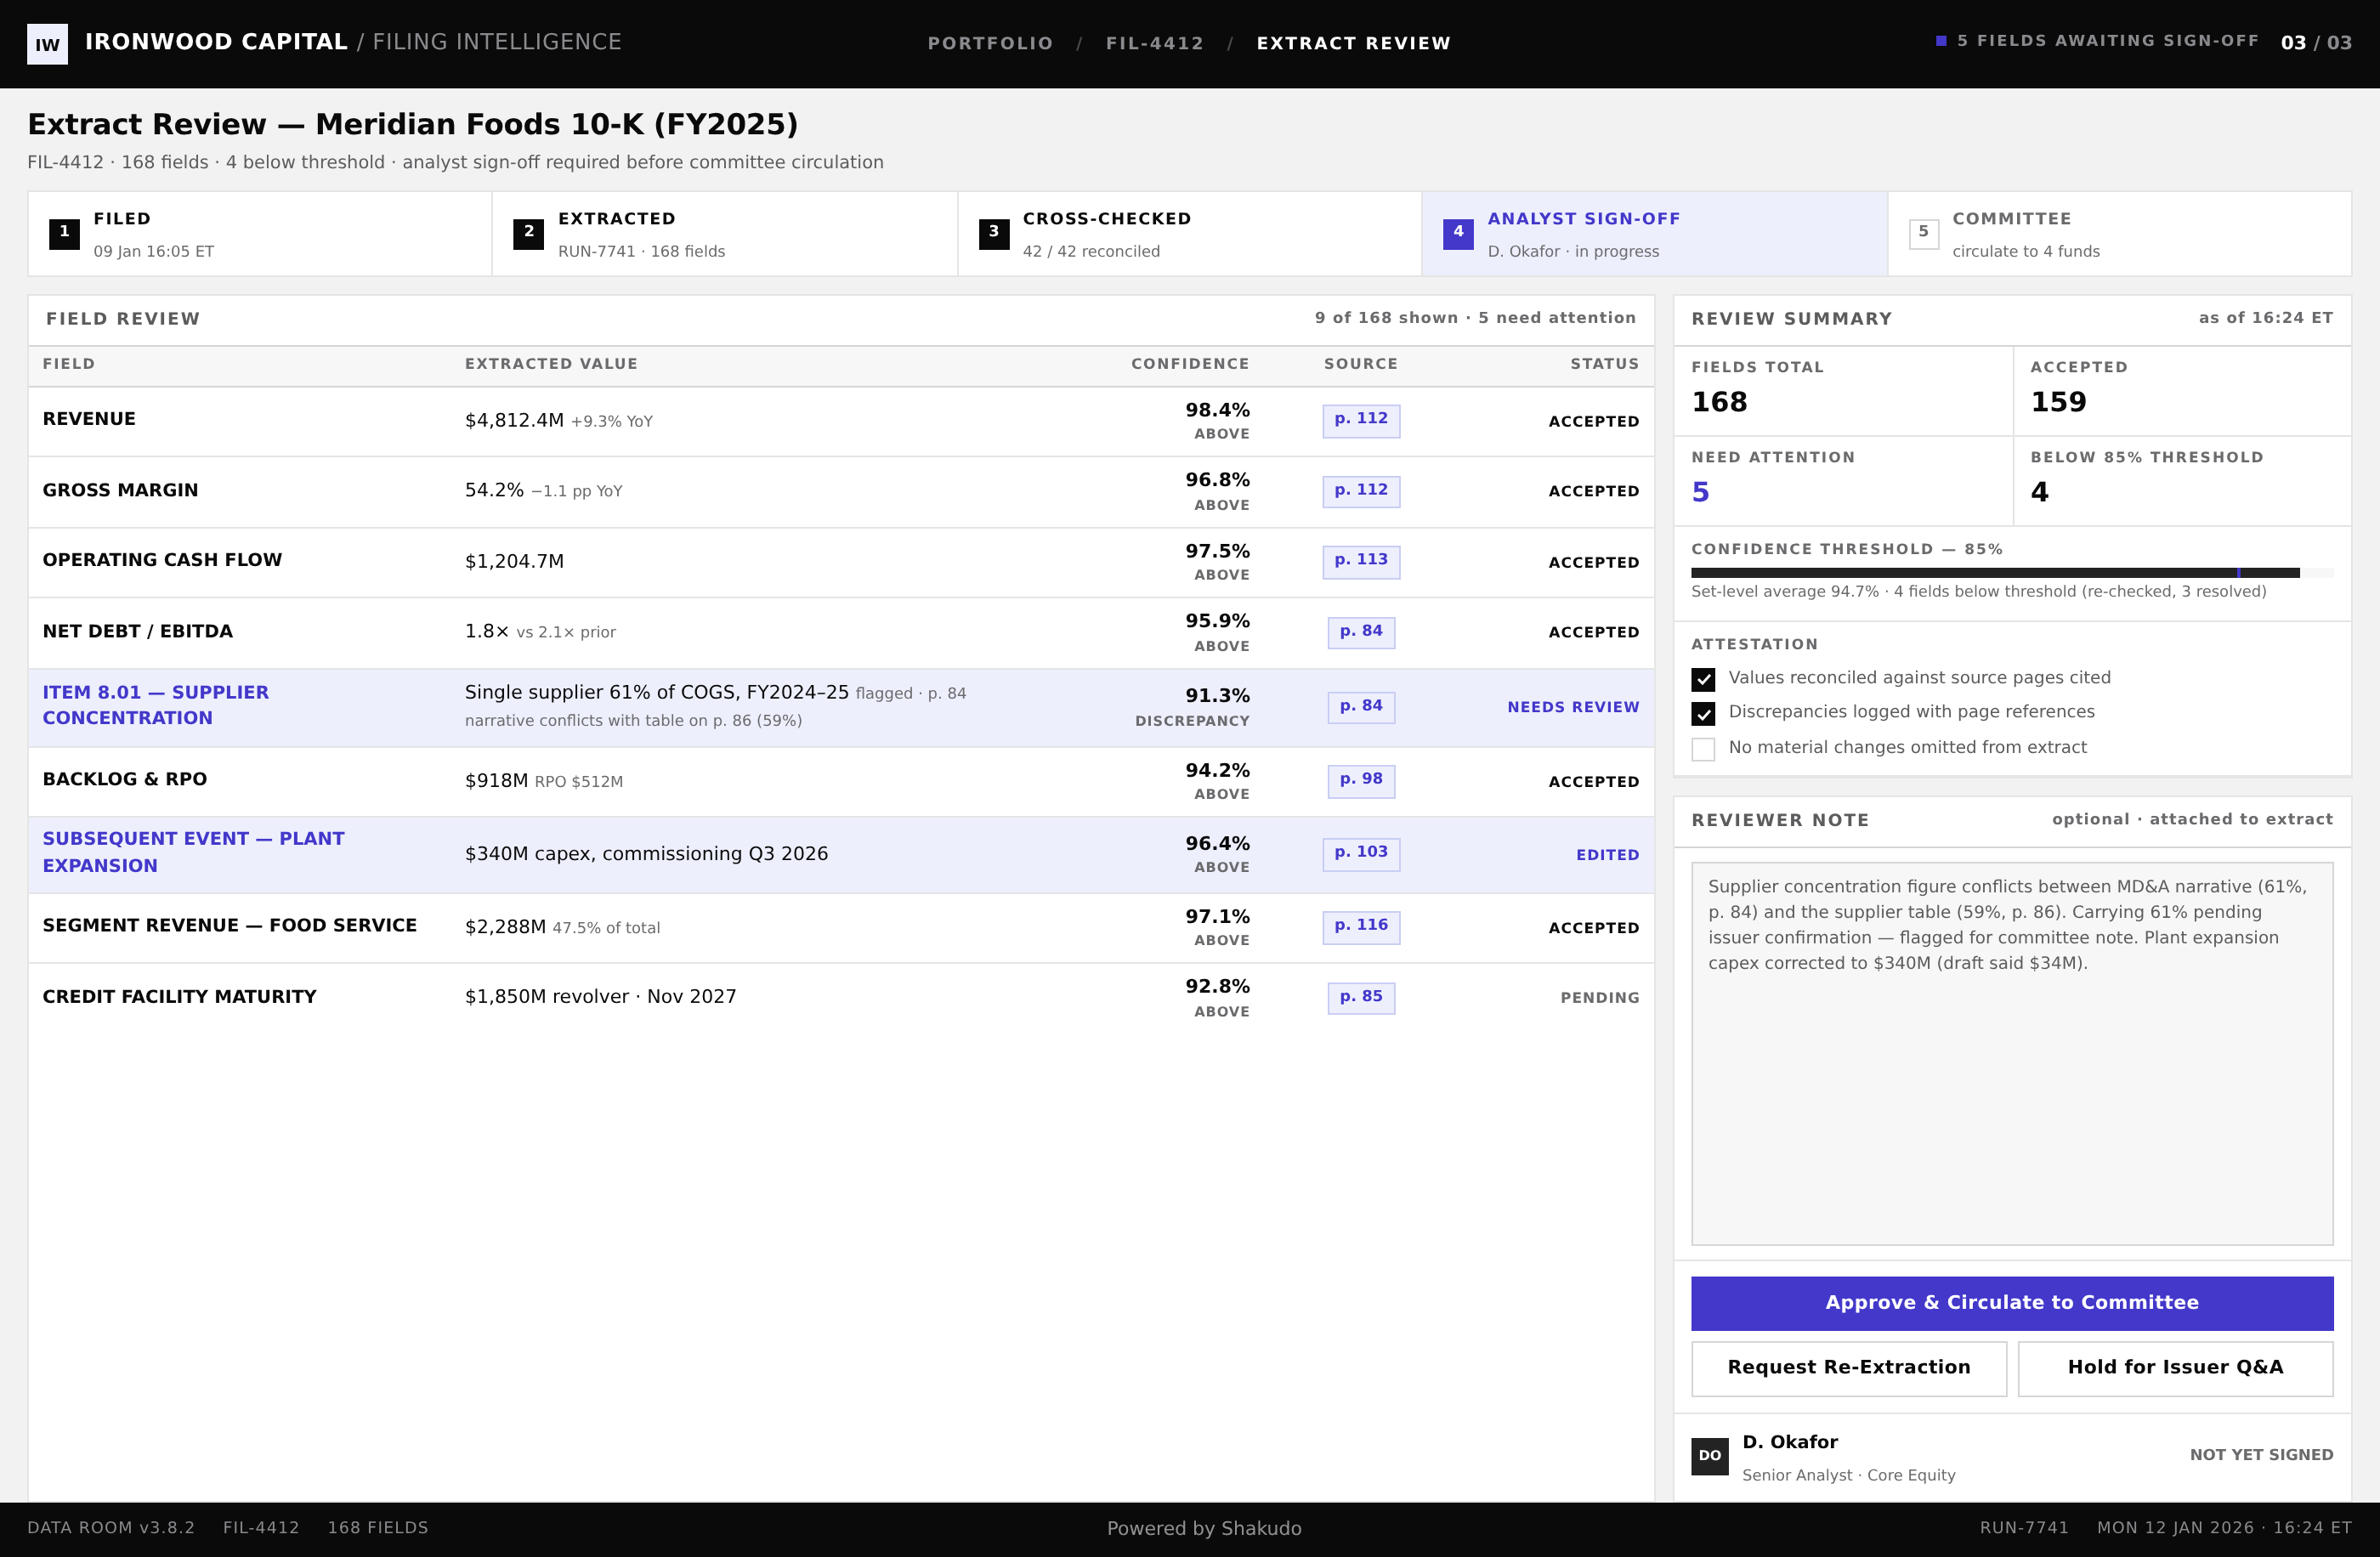
Three screens from a live run: the filing queue, the extracted data, and the reconciliation view.
1–2 / 3
An investment analyst reading a single 10-K can spend a full day pulling holdings data, risk factors and material events into a spreadsheet. Multiply that by the thousands of filings the SEC's EDGAR database publishes each quarter, across a book of 20 portfolios, and the manual review becomes a bottleneck that delays investment decisions and leaves compliance gaps. A pipeline that reads the filings as they are published closes that gap.
The SEC EDGAR database holds over 18 million searchable filing manifests with coverage back to 1993, and investment teams need specific data points from 10-K annual reports, 10-Q quarterly filings and 8-K material event disclosures. These documents often run hundreds of pages of dense financial text, complex tables and risk factor narratives. A single 10-K can contain 200 or more pages, and the material disclosure an analyst needs can be buried in a footnote or a supplementary schedule.
The lag is the real risk. When a portfolio manager needs to compare holdings across 20 portfolios against current regulatory disclosures, manual review stretches the gap between filing publication and actionable analysis to days or weeks. An 8-K filed on a material event can signal a portfolio-relevant change that requires immediate attention, and teams operating on stale information miss the time-sensitive window entirely.
Shakudo builds the pipeline that turns filing publication into a dashboard alert in minutes. A Python and LangChain pipeline processes SEC filings as they appear on EDGAR, and large language models extract structured data from unstructured filing text: holdings information, risk factor changes and material event summaries, each linked back to its source filing. Pinecone indexes the filing content for semantic retrieval, so analysts can query across years of filings and track how risk language evolves, and Streamlit powers the dashboards that display portfolio performance metrics alongside regulatory signals.
In a deployment on 20 simulated portfolios, each holding a diverse set of sector positions, the pipeline tracked performance against benchmarks while monitoring related regulatory filings. When a company in the book filed an 8-K material event, the dashboard flagged it within minutes of publication. What previously took days of analyst review surfaced in under five minutes from publication to alert, and the analysts moved from reading filings to acting on the signals they extracted.
Pinecone serves as the vector database that indexes filing content for semantic retrieval across years of documents. FastAPI exposes the extraction and analytics endpoints to the dashboard layer, and Streamlit provides the interactive dashboards where analysts see portfolio metrics and regulatory signals together.
The pipeline fits the teams where filing volume makes manual review a measurable cost: portfolio analysts and research staff who read 10-K, 10-Q and 8-K filings to update holdings and risk views, compliance officers who need to verify that material disclosures are tracked against the book, and portfolio managers who need current regulatory signals at the moment they make allocation decisions. It is built for financial services firms where the lag between EDGAR publication and analyst review is a documented problem.
Language models parse the unstructured text in filings like 10-K and 8-K reports, identifying holdings, risk factors and material events, then convert that text into structured data. XBRL tags on financial statements provide structured data directly and are parsed alongside the LLM extraction, and every extracted value links back to the source filing for verification.
The pipeline processes 10-K annual reports, 10-Q quarterly filings, 8-K material event disclosures and S-1 registration statements. Each filing type carries different information, and the extraction layer identifies the filing type and applies the appropriate parsing rules, so the structured output stays consistent across the full range of documents.
Extracted data appears on dashboards within minutes of a filing publication on EDGAR, and the reference deployment surfaced alerts in under five minutes from publication to dashboard. That compares to days or weeks for manual analyst review, and the difference matters most for time-sensitive material events where the decision window closes quickly.
Every extracted data point links back to its source filing with the SEC accession number and URL, so a compliance team can trace any figure on the dashboard to the original document. Extracted financial metrics are validated against XBRL structured data where available, and the system maintains an audit log of every extraction, including the timestamp and the model version that produced it.
When the goal is portfolio intelligence that reflects regulatory filings in minutes instead of days, a conversation with Shakudo is the fastest way to see it on your own data. The pipeline deploys on your own infrastructure, on-prem or in your cloud, with a first working extraction running within days. Book a demo to try it.
A financial services company can automate the extraction of data from SEC filings and combine it with portfolio analytics to build real-time intelligence dashboards. This approach replaces manual document review with structured data pipelines that surface risks, opportunities, and compliance signals across holdings.










"What drew me in is simple. When developers ship production-ready code this quickly, how can I have environments spun up fast enough? Shakudo is how we close that gap."



"Shakudo does not just provide the platform. It is a real partnership. They are always there to help and execute our vision faster and the right way. It is like a co-team working together to achieve our goals."