







Three screens from a live deck build: the pipeline, the slide generation, and the sign-off.
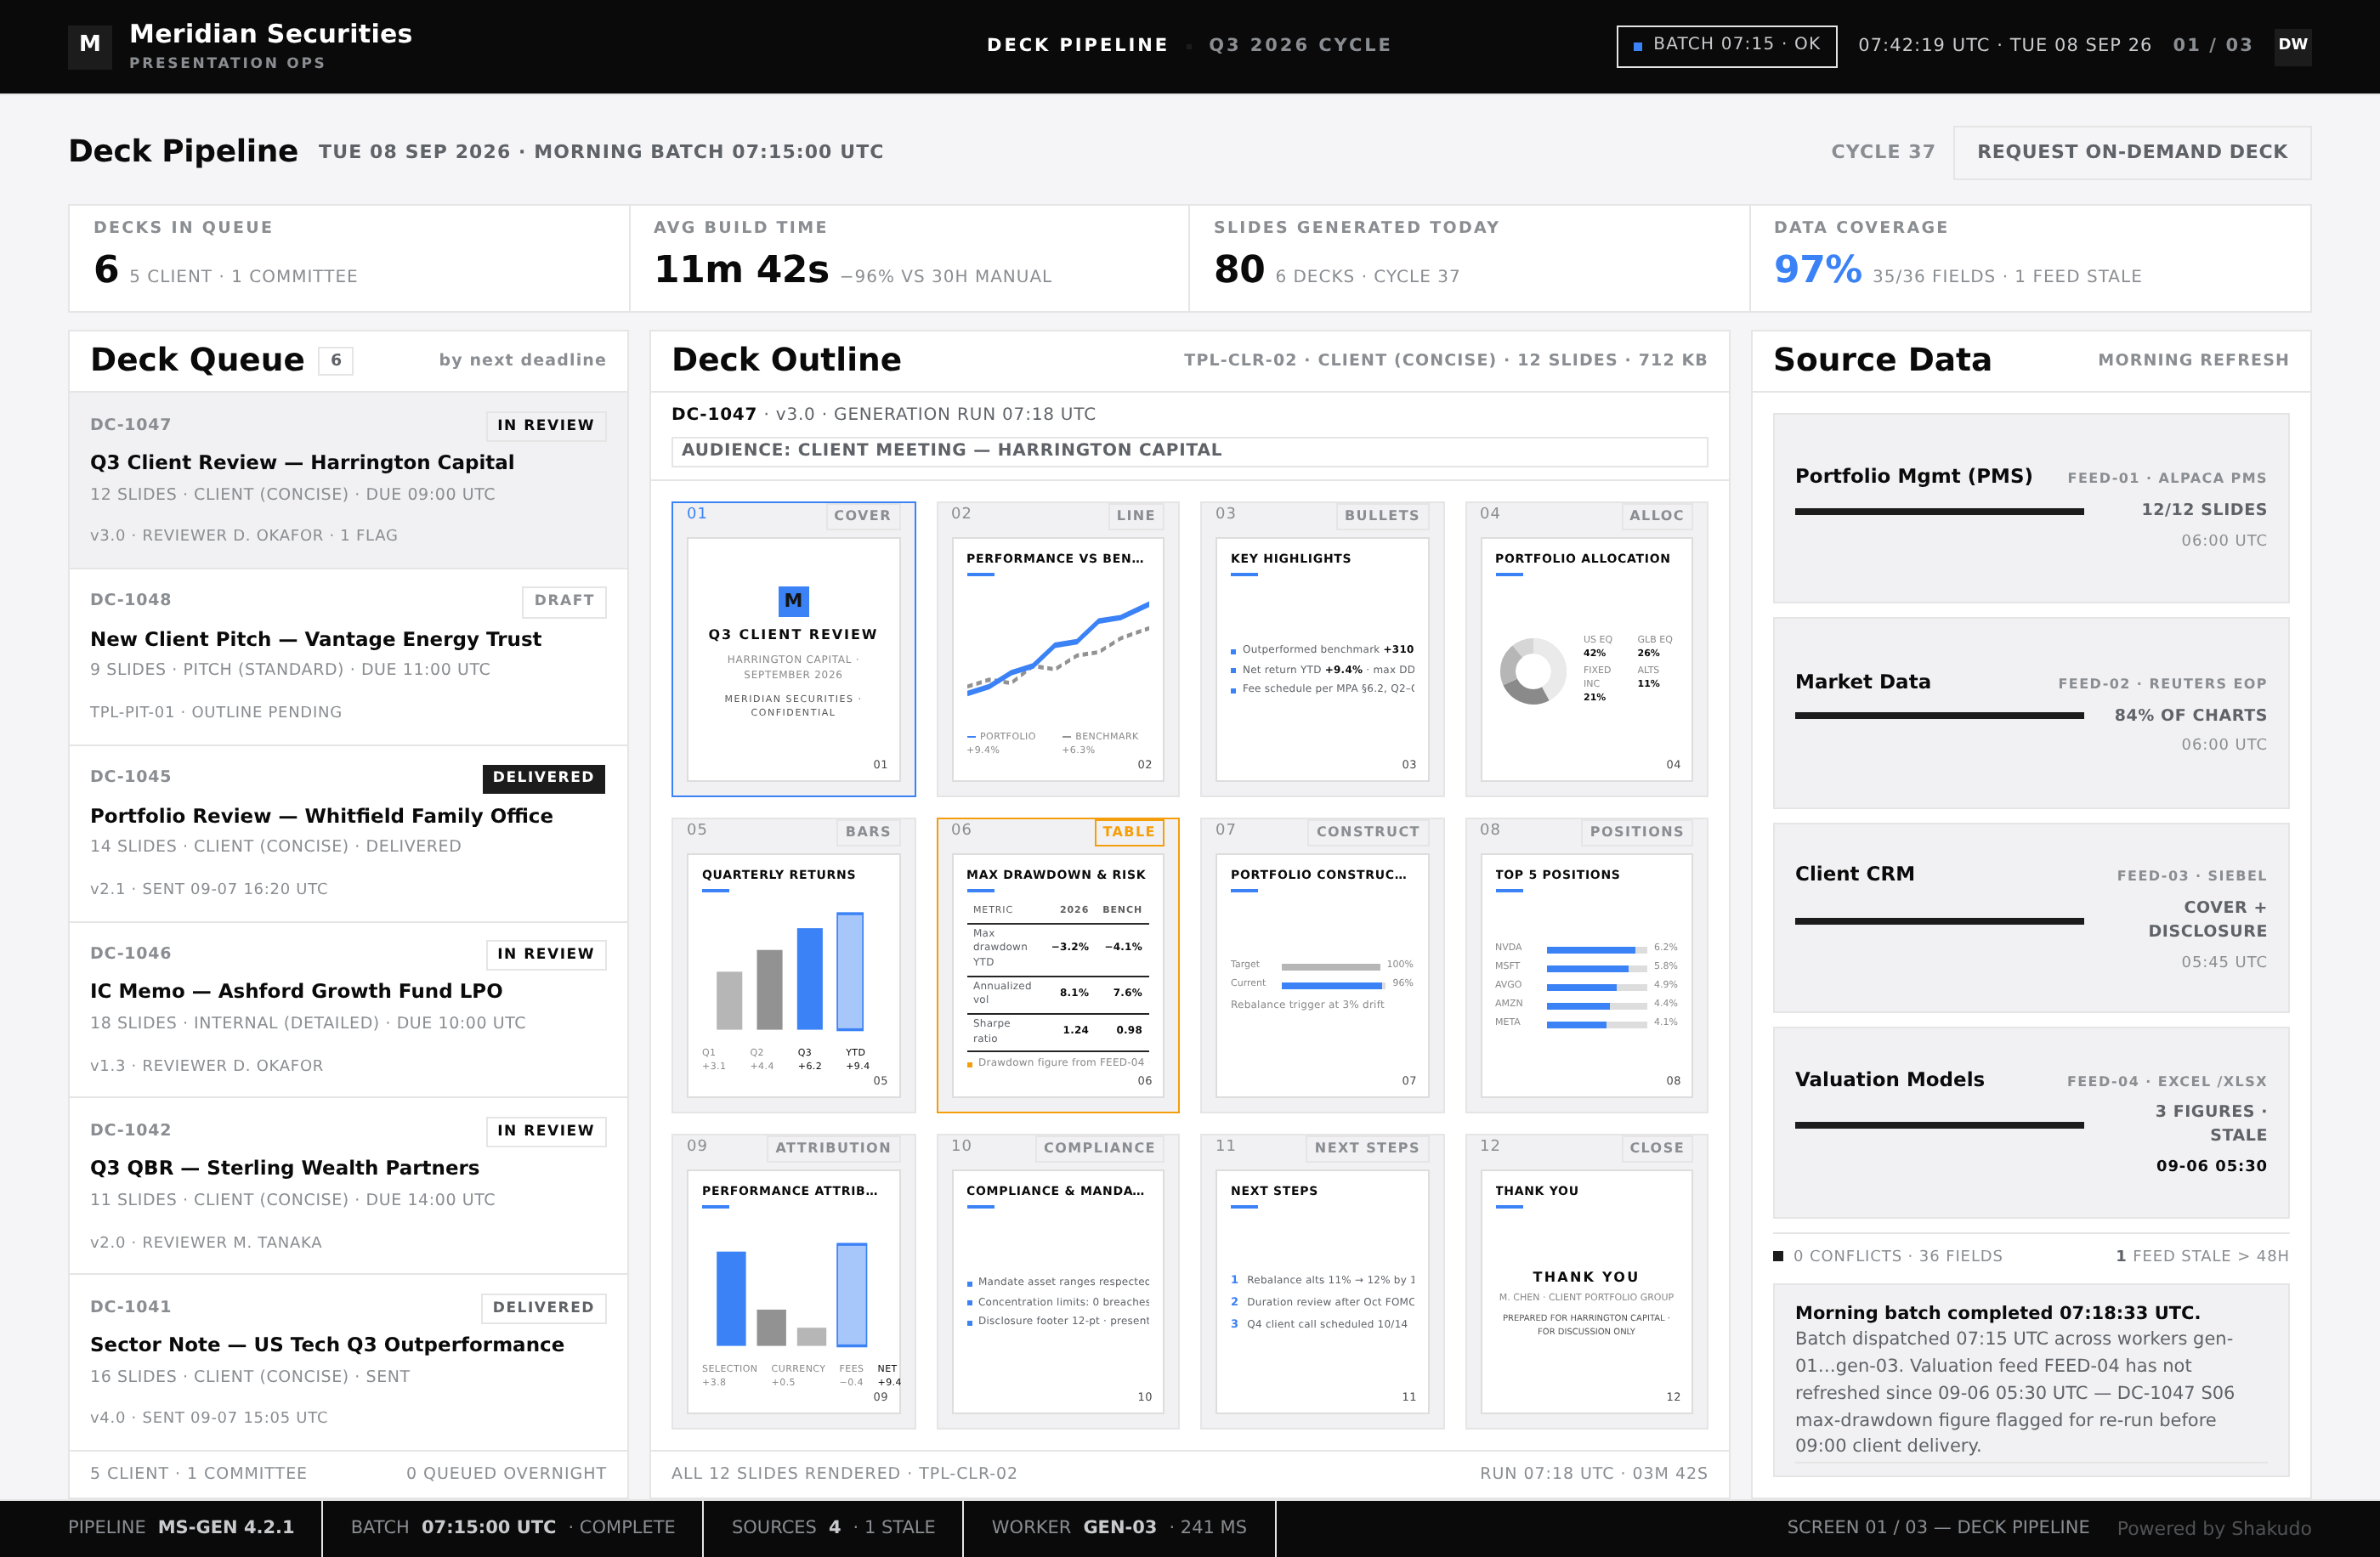
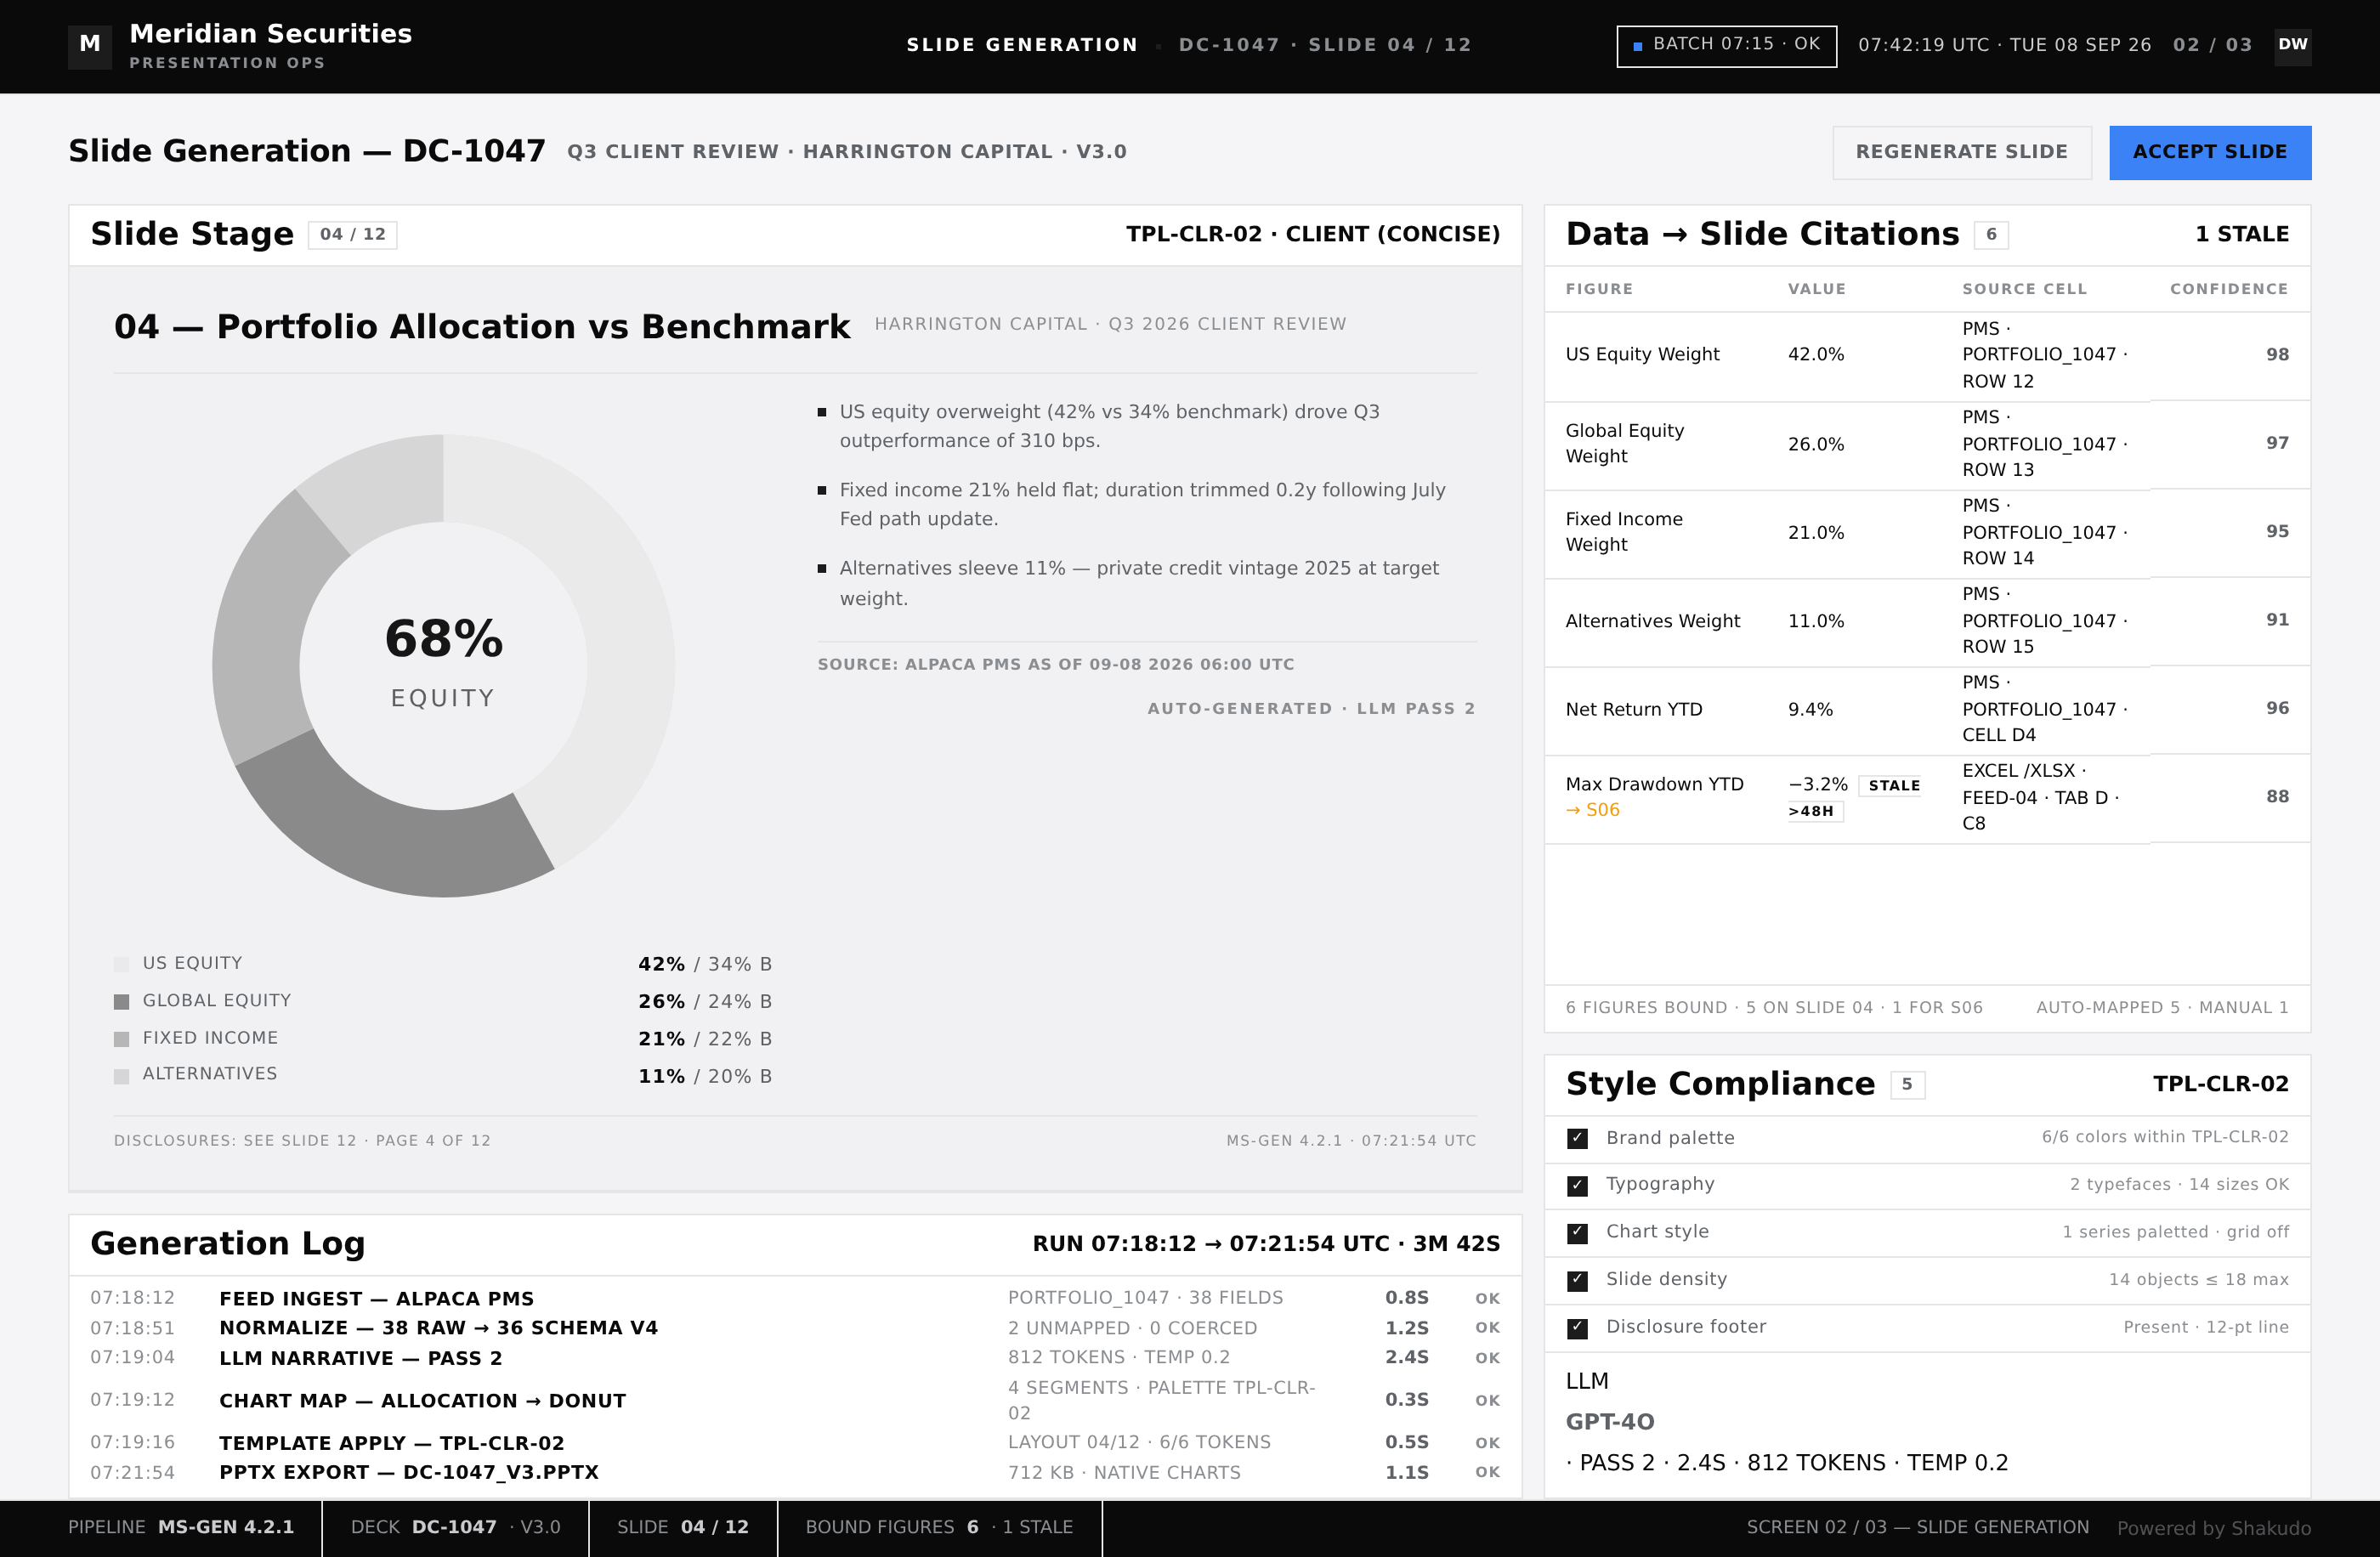
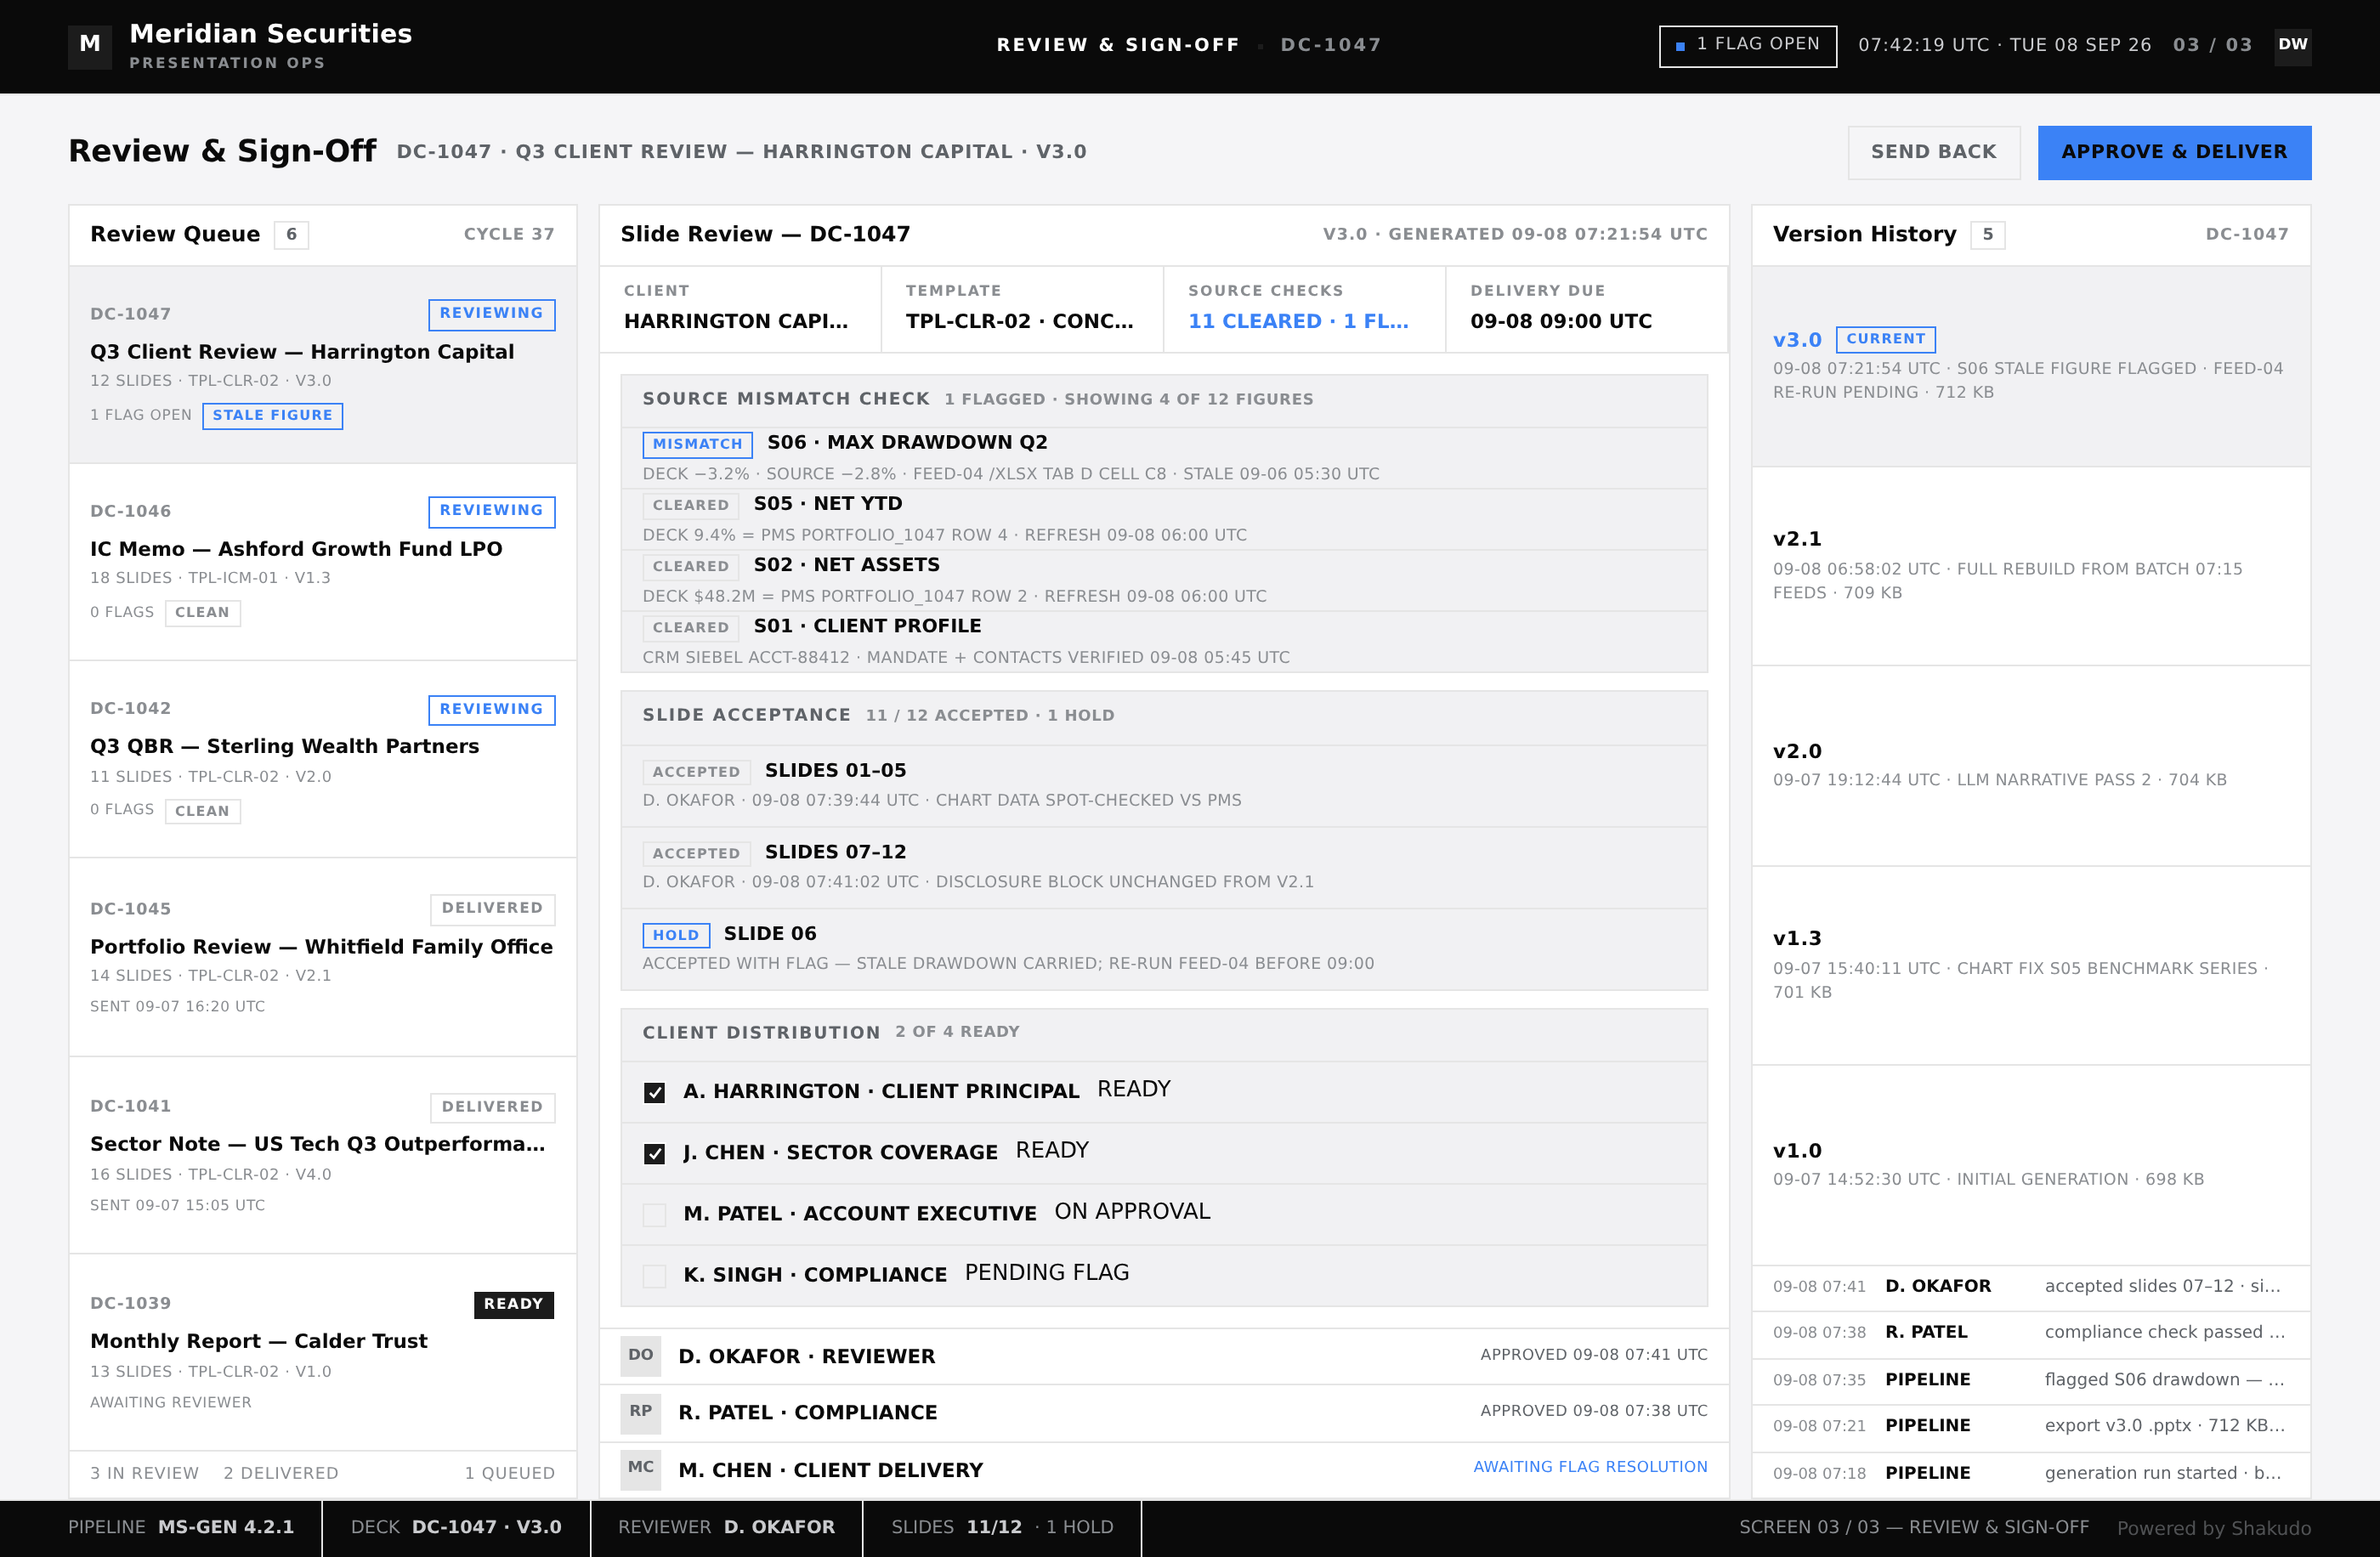
1–2 / 3
Financial professionals spend significant time building PowerPoint presentations. Pitch decks, quarterly reviews and client reports demand consistent branding, accurate data and polished design. A single pitch deck can take 20 to 40 hours to assemble, and every revision cycle repeats the same manual formatting, chart rebuilding and number checking.
For a firm producing dozens of decks per quarter, that time adds up fast. Automated PowerPoint generation turns structured data into branded, presentation-ready decks in minutes, so teams focus on analysis and client work instead of formatting slides.
Analysts copy data between spreadsheets and slides, reformat charts to match brand guidelines and manually verify every number. Each revision cycle introduces new error risk. A misplaced decimal or an outdated figure in a client deck can damage credibility in an instant, and the fix requires another full formatting pass.
A firm with 50 analysts each producing 4 presentations per quarter spends roughly 8,000 hours annually on slide creation alone. That figure excludes review cycles, formatting fixes and version control. Industry research suggests professionals spend up to 30 percent of their work time on presentation-related tasks, which for high-value deal and portfolio teams is capacity pulled directly from revenue work.
Shakudo builds a data-to-deck pipeline that connects directly to the firm's data sources and produces complete slide decks on demand. Financial models, portfolio performance data, market research and client profiles feed the pipeline. A language model extracts the key insights and structures them into a narrative arc, the pipeline maps content to prebuilt brand templates, and charts render live from connected data using the firm's color palette and typography. The output is a native PowerPoint file an analyst can open, adjust and share.
The measurable outcomes from a financial services deployment: presentation creation time dropped from an average of 30 hours per deck to under 2 hours, brand compliance issues fell to near zero because templates are applied programmatically, and the firm served 40 percent more clients with the same team size. Analysts shifted their time from formatting slides to reviewing content and refining narratives.
Implementation starts by normalizing inputs. A data ingestion layer pulls portfolio performance from the portfolio management system, market data from external feeds and client information from the CRM into a consistent format. A scheduled job generates updated client presentations each morning, with on-demand generation for ad hoc requests. Different templates serve different audiences: a detailed version for internal investment committees and a concise version for client meetings.
Chart generation maps data fields to chart types automatically. Time series data becomes line charts, portfolio allocations become pie charts and benchmark comparisons become bar charts, with each chart pulling live data at generation time so the numbers are always current. Because the output is a standard .pptx file, analysts make final adjustments in PowerPoint before sending, and nothing in the pipeline writes back to the firm's source systems.
Python provides the pipeline runtime that orchestrates ingestion, generation and assembly. LangChain structures the language model calls that turn raw numbers into narrative descriptions and key takeaways. OpenAI handles the content generation, extracting insights from financial data and writing the slide text for each audience. python-pptx builds the final deck, applying the firm's template layouts, fonts and chart styling to produce a native PowerPoint file.
FastAPI exposes the generation pipeline as an API, so the CRM, reporting tools or a scheduled job can request a deck by specifying the data source, audience and template. Streamlit provides the internal dashboard where analysts preview generated decks, review chart data and trigger on-demand generation without writing code.
This solution fits financial services firms that produce client-facing decks at volume: investment banks building pitch materials, asset managers running quarterly client reports, wealth advisory teams preparing portfolio reviews and private equity deal teams assembling investment committee materials. The buyer is typically the head of research or client reporting, with analysts and associate teams as the daily users.
Yes. The output is a standard .pptx file with native charts and editable text. Analysts open it in PowerPoint, adjust any element and share it normally. The generated file is not a static image or web link but a real PowerPoint document.
The system uses predefined PowerPoint templates as a foundation. Each template defines slide layouts, fonts, color palettes and chart styling. When the AI generates content, it maps each piece to the appropriate template layout, so every deck matches the firm's visual standards without manual formatting.
Common inputs include financial databases, portfolio management systems, CRM platforms, market data feeds and Excel models. The pipeline normalizes data from these sources and feeds it into the content generation and chart rendering layers. Structured data like portfolio holdings and performance metrics work particularly well for automated chart population.
A basic pipeline that generates decks from a single data source can be operational in a few weeks. More complex deployments connecting multiple systems with custom templates and approval workflows take 6 to 8 weeks. The timeline depends on the number of data sources, template complexity and integration requirements.
When the goal is decks and client reports built from live data, a conversation with Shakudo is the fastest way to see it on your own data. The pipeline deploys on your own infrastructure, on-prem or in your cloud, and a first working generator is in place within days. Book a demo to review the output.
AI presentation generation transforms raw data into branded slide decks in minutes. Financial services firms produce pitch decks and client presentations on tight deadlines. This solution applies brand templates and populates charts automatically from connected data sources.










"What drew me in is simple. When developers ship production-ready code this quickly, how can I have environments spun up fast enough? Shakudo is how we close that gap."



"Shakudo does not just provide the platform. It is a real partnership. They are always there to help and execute our vision faster and the right way. It is like a co-team working together to achieve our goals."