
The AIOps market stood at USD 16.42 billion in 2025 and is forecast to reach USD 36.60 billion by 2030, advancing at a 17.39% CAGR, yet enterprises face a critical decision: proprietary platforms that control your operational data, or open-source tools that preserve sovereignty while delivering equivalent intelligence. The answer increasingly points toward open-source, particularly for organizations managing sensitive infrastructure across healthcare, finance, and government sectors.
This convergence of market growth and data sensitivity creates a compelling case for open-source AIOps tooling. 55% of organizations are already using AIOps, and another 19% plan to adopt it within the next year. For enterprises committed to maintaining control over their operational telemetry while achieving the predictive capabilities that define modern IT operations, open-source solutions offer a viable path forward.
Enterprises struggle with complex hybrid clouds, escalating observability data, and the pressure to cut operating costs while raising service resilience. The numbers reveal the scale of this challenge: many organizations juggle five or more monitoring tools, fragmenting context and delaying action, with integration costs rising before AIOps delivers value.
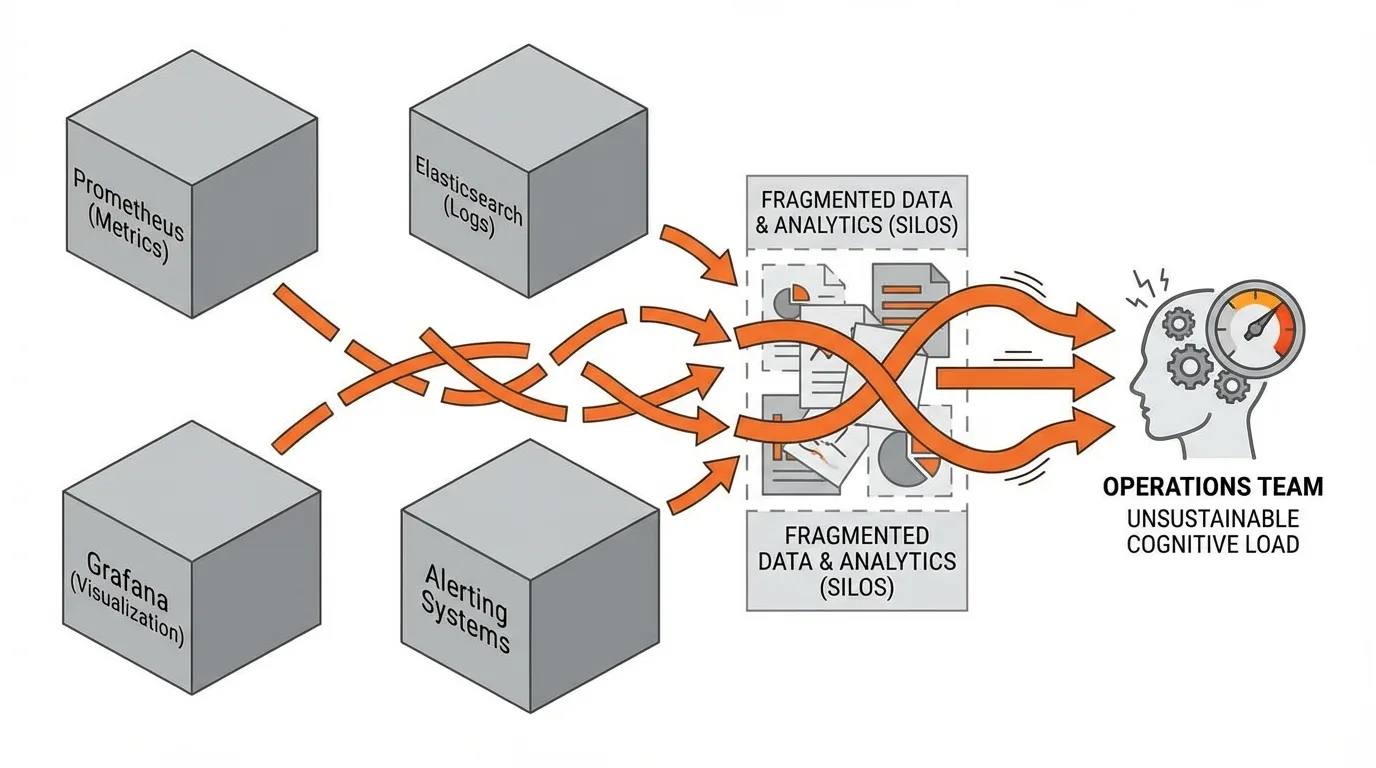
Beyond tooling sprawl, enterprises confront a more fundamental issue. Data silos and disparate systems make data quality and integration a challenge and hinder comprehensive analytics. When your monitoring infrastructure spans Prometheus for metrics, Elasticsearch for logs, Grafana for visualization, and various alerting systems, the cognitive load on operations teams becomes unsustainable.
AI models help reduce notification fatigue by deduplicating and correlating alerts, transforming thousands of individual signals into actionable insights. However, sending your operational telemetry to third-party SaaS platforms introduces compliance risk, vendor lock-in, and loss of control over sensitive performance data that may reveal architectural patterns, security postures, or business operations.
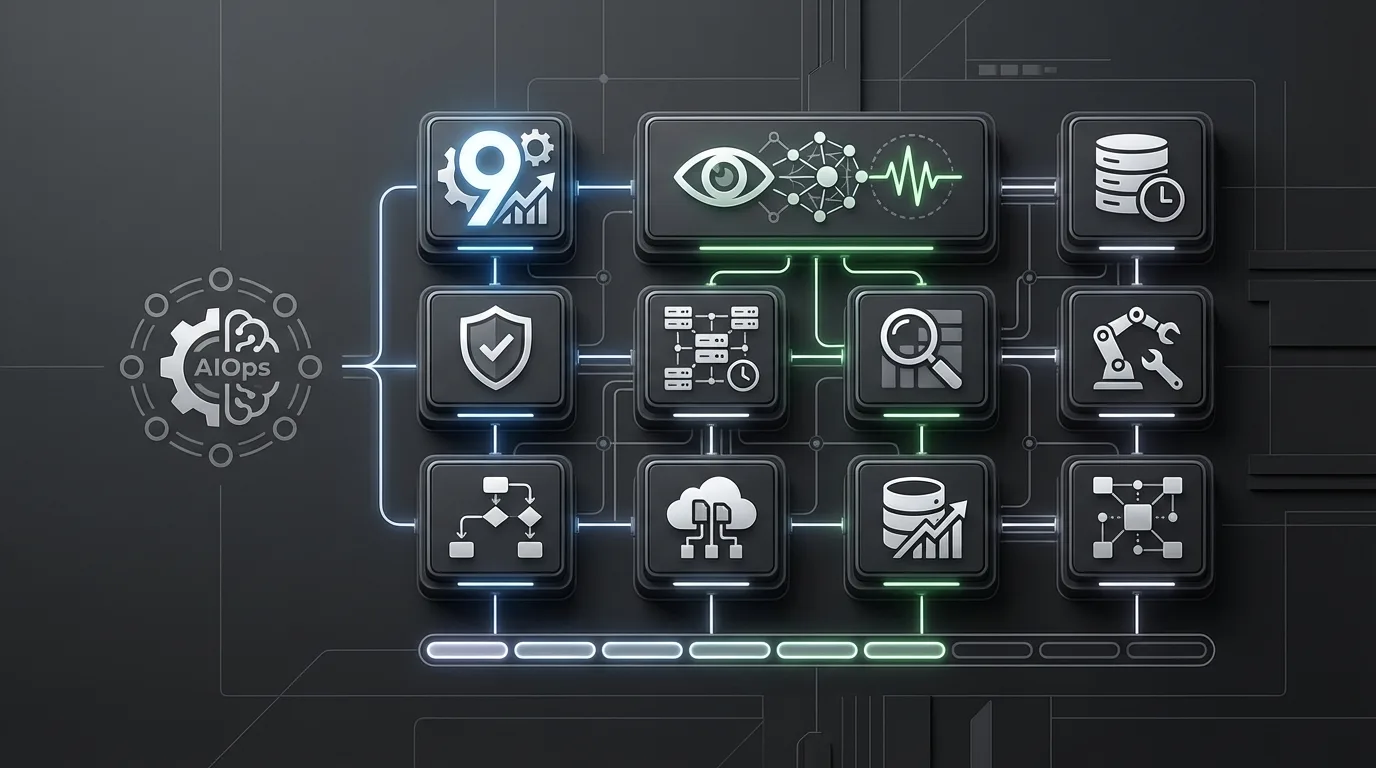
The open-source ecosystem provides production-ready components for building comprehensive AIOps capabilities while maintaining complete data control.
Prometheus is an open-source monitoring system designed for collecting and storing time-series data, widely used for its efficiency and flexibility in monitoring and alerting infrastructure and application performance. Prometheus, functioning as the central monitoring component, adopts a pull-based approach to collect metrics from Kubernetes nodes and pods.
Prometheus excels at metrics collection with its powerful PromQL query language, service discovery, and native Kubernetes integration. It achieved a 67% year-over-year increase in downloads, totaling over 165.7 million in 2023, highlighting its status as a top workflow tool within the Apache Airflow ecosystem, though this adoption extends broadly across monitoring deployments.
Grafana is an open-source data visualization platform that allows users to create rich, interactive dashboards to visualize time-series data and other metrics. Beyond static dashboards, Grafana's Machine Learning plugin allows you to detect outliers in your metrics, bringing AI-powered anomaly detection directly into your visualization layer.
Grafana's ML model can analyse historical data and forecast future CPU usage trends, enabling proactive capacity planning. These tools help detect and resolve issues more rapidly and accurately through improved root cause analysis, reducing the mean time to resolution (MTTR) and enhancing understanding of system behavior.
The Elastic Stack combines Elasticsearch, Logstash, and Kibana into a comprehensive log analysis platform. Elasticsearch provides the search and analytics engine, Logstash handles data ingestion and transformation, while Kibana delivers visualization capabilities. Tools like Prometheus, Fluentd, and Kafka enable scalable and reliable data ingestion, and Elastic Stack integrates naturally with these components.
For AIOps implementations, Elastic Stack excels at centralizing logs from distributed systems, enabling full-text search across operational data, and correlating events across microservices architectures. Machine learning features built into Elasticsearch detect anomalies in log patterns that might indicate security incidents or performance degradation.
Keep is an open-source alert management and AIOps platform that is a swiss-knife for alerting, automation, and noise reduction. Keep acts as a single pane of glass to all your alerts from any monitoring tool and helps you turn 1000s into just 10s of meaningful alerts.
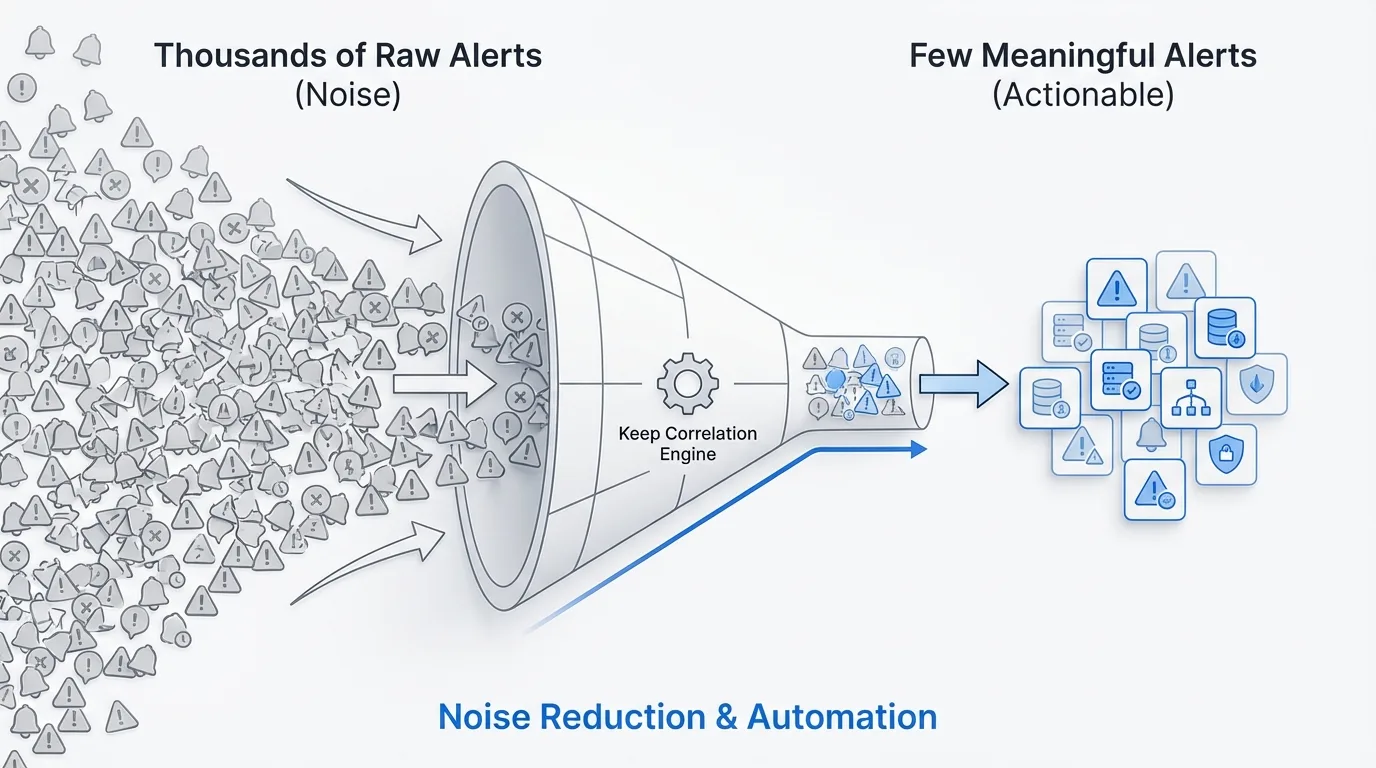
At its core, Keep is an integration service that pulls in data from a wide variety of infrastructure services and observability tools and then uses all of this data to enrich the individual alerts with more context. Keep's AI models provide support for things like noise reduction, event correlation, and automated root cause analysis, addressing alert fatigue directly through intelligent deduplication.
Seldon core converts machine learning models (e.g. Pytorch, Tensorflow, H2o) or language wrappers (Python, Java, etc.) into production REST/GRPC microservices. For AIOps implementations, this means deploying custom anomaly detection models, forecasting algorithms, or classification systems directly into your infrastructure.
Seldon Core handles the operational complexity of serving ML models at scale, including A/B testing, canary deployments, and model explainability. This enables enterprises to build proprietary AIOps intelligence while maintaining full control over model behavior and data processing.
Airflow is an open-source platform that makes it easier to schedule and monitor workflows, efficiently pulling logs from AWS CloudTrail and sending that data to anomaly detection models. Airflow orchestrates complex data pipelines that feed AIOps systems, managing dependencies between metric collection, log aggregation, feature engineering, and model inference.
For enterprises building custom AIOps workflows, Airflow provides programmatic pipeline definition through Python, extensive monitoring and alerting on pipeline health, and integration with virtually every data system in the modern stack.
Metaflow, developed by Netflix, simplifies machine learning workflows, built on Python and integrating seamlessly with AWS services like S3 and Batch, making it simple to manage tasks like data preprocessing and model training. Metaflow brings production ML practices to AIOps development, handling versioning, experiment tracking, and deployment automation.
Metaflow particularly excels at managing the iteration cycles required for tuning anomaly detection thresholds, testing forecasting models, or evaluating correlation algorithms against historical incident data.
AIOpsTools is a toolkit for Python developers who want to use existing features to build AIOps applications, realizing some Ops scenes by using artificial intelligence with easy module imports to achieve functions. While documentation remains primarily in Chinese, the toolkit provides pre-built capabilities for common AIOps scenarios including anomaly detection, root cause analysis, and failure prediction.
For development teams building custom AIOps solutions rather than deploying pre-packaged platforms, AIOpsTools accelerates implementation by providing tested algorithms and integration patterns.
Log anomaly detector (LAD) is an open source project code named 'Project Scorpio' that can connect to streaming sources and produce predictions of abnormal log lines using unsupervised machine learning. It involves a human in the loop feedback system, allowing operations teams to correct false positives and improve model accuracy over time.
LAD addresses a critical AIOps use case: detecting novel failure modes in log data without requiring labeled training examples. This unsupervised approach proves particularly valuable when dealing with constantly evolving microservices architectures where failure patterns change frequently.
Organizations implementing AIOps achieve a 50% reduction in downtime, reduce operational expenses by up to 80%, and realize a 130% ROI with a net present value of $2.94 million. These outcomes apply equally to open-source and proprietary implementations, yet open-source approaches deliver additional strategic advantages.
Data sovereignty remains paramount for regulated industries. When operational telemetry reveals application architecture, user behavior patterns, security postures, and business transaction flows, exfiltrating this data to third-party platforms creates compliance risk and potential competitive exposure. Open-source AIOps tools running on private infrastructure eliminate this concern entirely.
Building a custom AIOps stack from scratch gives you ultimate control, but also requires significant expertise to integrate, manage, and scale these disparate systems, demanding time and resources that could be spent on other business priorities. This integration tax represents the primary barrier to open-source AIOps adoption.
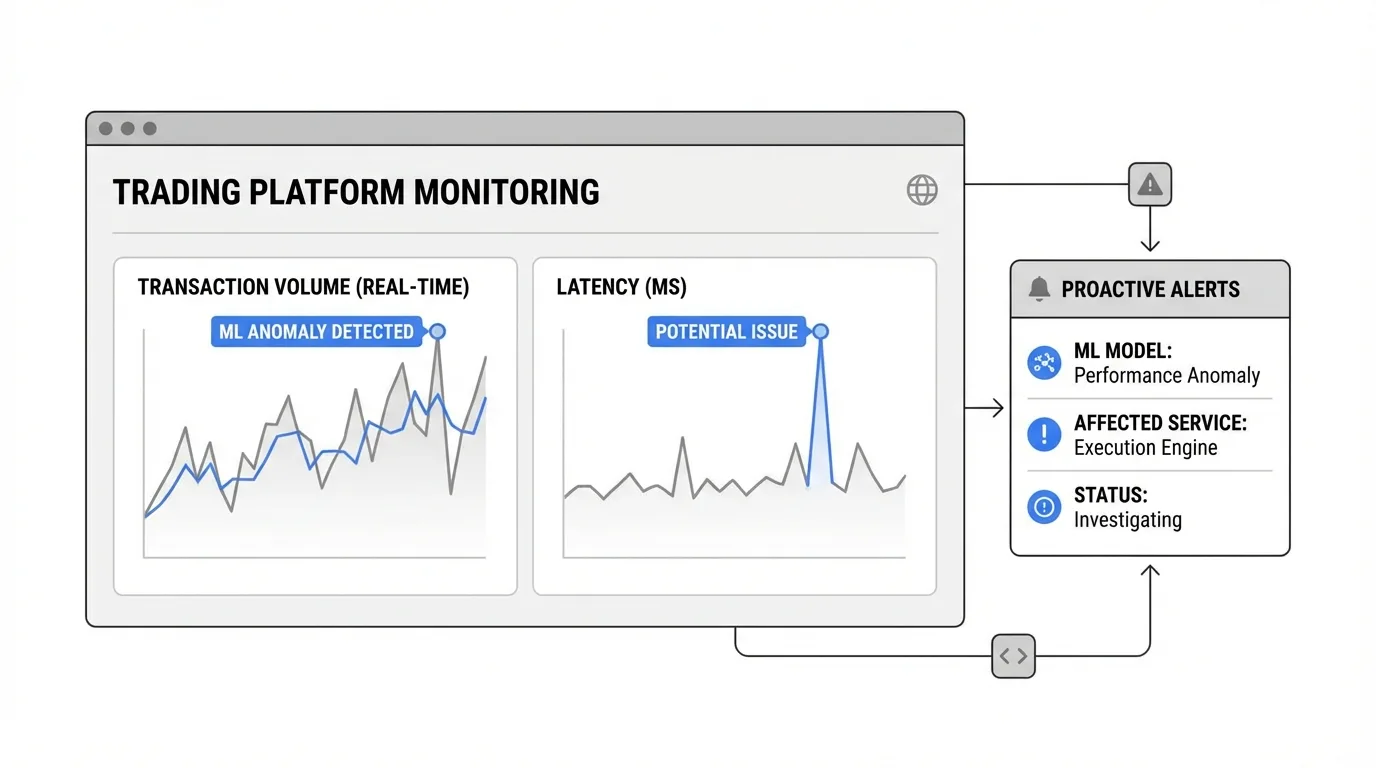
Combining basic anomaly detection and machine learning enables automatic anomaly identification in real time, serving as the cornerstone for proactive IT operations, allowing teams to identify issues early on and automate solutions. Financial services organizations deploy Prometheus and Grafana with machine learning plugins to monitor trading platforms, detecting performance anomalies before they impact transaction processing.
A leading U.S. bank reduced cloud costs by 30–40% and improved application performance by implementing IBM Turbonomic to right-size EC2 instances, optimize RDS, and reduce memory usage. While this example uses a proprietary tool, similar outcomes emerge from open-source implementations. A UK bank increased platform uptime and reduced incident troubleshooting time by 7–10 minutes using an AI/ML-powered AIOps solution, which included auto-healing and predictive incident management.
A comprehensive, enterprise-ready pipeline for real-time anomaly detection in network operations using AIOps principles handles large-scale, real-time operations efficiently while adapting to evolving network patterns, demonstrating production viability for open-source AIOps architectures.
Building or deploying a full AIOps platform typically takes 16 months or longer, creating a substantial barrier to adoption. The most common obstacles companies reported include cost, data quality, conflicts within IT, distrust of AI, lack of skills, and integration challenges.
Data quality forms the foundation of effective AIOps. The success of AIOps depends on the quality of your data. Inconsistent metric naming, irregular collection intervals, missing contextual labels, and fragmented data sources all degrade model accuracy and correlation effectiveness.
Skills requirements span multiple domains. Effective AIOps implementations require expertise in:
Cost, data quality, conflicts within IT, distrust of AI, lack of skills, and integration challenges are the most common obstacles to AIOps adoption. Organizational resistance often stems from fear that automation will eliminate operations roles, when in reality AIOps shifts responsibilities from reactive firefighting toward strategic improvement—similar to how autonomous workflows transform operations teams into strategic partners.
Shakudo eliminates the 16-month integration timeline by providing pre-integrated open-source AIOps components that deploy on your private infrastructure in days rather than quarters. The platform handles the operational complexity of running Prometheus, Grafana, Elastic Stack, Keep, and other tools at scale while maintaining complete data sovereignty.
For enterprises that need open-source flexibility without sacrificing deployment velocity, Shakudo provides:
This approach preserves the cost advantages and customization capabilities of open-source AIOps while removing the integration burden that typically consumes months of engineering effort and delays value realization.
Successful open-source AIOps adoption follows a staged approach:
By 2026, over 60% of large enterprises will have moved toward self-healing systems powered by AIOps, with open-source implementations playing a central role in this transformation. The combination of data sovereignty, cost efficiency, and customization flexibility makes open-source AIOps particularly attractive for enterprises managing sensitive infrastructure—especially in financial services where AI-powered monitoring requires strict compliance controls.
The decision between proprietary and open-source AIOps ultimately depends on your organization's priorities. For teams that value control over convenience, customization over convention, and data sovereignty over vendor-managed services, open-source tools provide a complete, production-ready path toward intelligent IT operations. The integration complexity once deterred adoption, but modern AI orchestration platforms eliminate this barrier while preserving the fundamental advantages that make open-source compelling.
The future of enterprise IT operations lies in systems that predict failures before they occur, correlate signals across fragmented tooling, and automate responses to known conditions. Open-source AIOps tools provide the components to build this future while maintaining control over the operational intelligence that defines your infrastructure.